The Tragedy of Fiat Money47 minuti
This is a translation of the italian article “La tragedia della moneta a corso forzoso“. It was written before the 2020 lockdown-hyperinflation era. Now everything you read below (already dreadful) is amplified to the nth degree. The underlying logic, however, is exactly the same. We might even say that this article is even predictive.
—
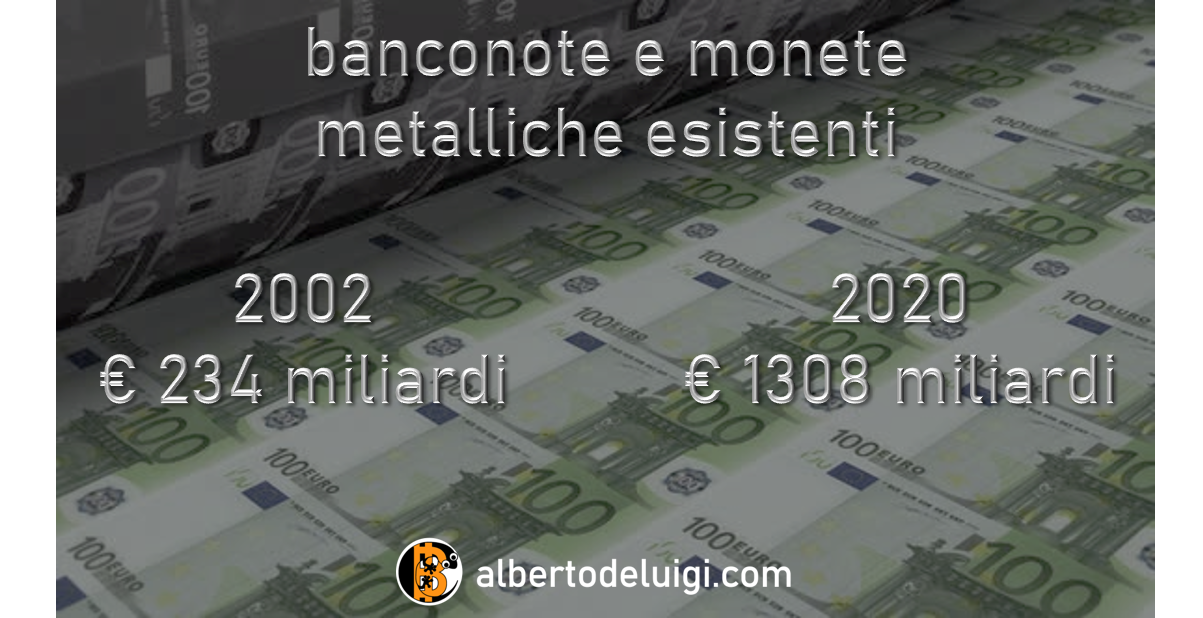
In January 2002, the total value of physically existing euros, including banknotes and metal coins, amounted to 234 billion. Over the course of 18 years, the European Central Bank (ECB) printed new currency, multiplying this figure by more than 5 times, bringing it to 1308 billion[2]. The plan for the robbery devised by the “Professor” in “La Casa de Papel” involved printing 2 billion euros, whereas the ECB, in 18 years, has issued over 1,000 billion euros in banknotes alone. Whether or not the central bank’s actions could be considered a robbery is up to you to decide, but only after finishing reading this article.
In the previus article We have seen how and why fiat money was invented in the history of human civilization. Here, we will focus on explaining the problems it entails.
INTRO: WHO POCKETS THE MONEY CREATED OUT OF NOWHERE?
- 1.1 The central bank’s “permanent” loan: a gift to the States
- 1.2 Negative interest rates: how to empty bank reserves
- 1.3 Quantitative easing: privileges to parasites at the expense of taxpayers
- 2.1 Hidden inflation: the cost of the public sector
- 2.2 Consumer price inflation: you don’t see it but it hurts
- 2.3 From savers to speculators: how central banks create financial bubbles
- 2.4 The idiocy of competitive devaluation
- 3.1 The “boiled frog” effect
- 3.2 Tiranny of the majority
- 3.3 Ignorance and ideology
- 3.4 The veil of progress
ANNEX: FOREIGN DEMAND FOR EUROS
INTRODUCTION: WHO POCKETS THE MONEY CREATED OUT OF NOWHERE?
 The amount of physical currency is only a small fraction of the circulating euros, as electronic currency is mostly used today. For an adequate calculation of the amount of currency in circulation, it is necessary to add the value of all current accounts, which are private bank accounting entries, mostly digital nowadays. The resulting monetary aggregate is called M1[3] and it is the one most widely used for statistical purposes. The quantity of M1 has quadrupled since the birth of the euro (2002): from 2,239 billion to 9,059 billion (nine trillion)[4]. This aggregate also includes a large portion of the credit created by banks through fractional reserve banking. The assets on the ECB’s balance sheet, which correspond to the total amount of euros provided by the central bank and include loans to banks, States, and State-owned or State-controlled companies, have also more than quadrupled, now [May 2020] amounting to over 4,500 billion compared to less than 1,000 billion in 2002.[5].
We could imagine that as a result of a four-fold increase in the money supply, the purchasing power of 1 euro should decrease to one quarter of its original value, which is a 75% reduction. However, the loss of purchasing power from 2002 to today has only been 33%[7], in line with the Central Bank’s objective to inflate[8] the currency by 2% annually.
Trillions created, yet the euro does not see a proportional loss of purchasing power. Is it really possible? If we did not know about the phenomenon and tried to intuit an explanation, we might say that monetary expansion is driven by a physiological increase in demand. However, neither an increase in domestic demand (GDP growth and/or money velocity) nor an increase in foreign demand for euros can explain the limited inflation compared to the monetary expansion of the last 18 years:
- The internal demand: from 2002 to 2019 the real GDP in EU grew by 23%[9][10], An increase on a much larger scale than the approximately 400% increase that would be necessary to compensate for the monetary expansion[11].
- The foreign demand: being seen as a store of value by many countries, one might think that the demand for the euro from foreign countries could have compensated for the increase in the money supply. Therefore, the euros circulating in the domestic market would not have increased significantly despite the creation of new money, as it was sent abroad. But to categorically refute this hypothesis, two fundamental data are available: (1) the amount of banknotes held abroad is only €162.5 billion; (2) the share that the euro represents as a reserve foreign currency held by all countries in the world (forex reserves) compared to other currencies has fallen from 23.65% (2002) to 19.2% today [May 2020]. Regarding this, I provide detailed data in the annex at the end of the article.
Even if there were an increase in foreign demand, it would still be legitimate for us all to benefit from it, with the natural appreciation of the euro that would result. Such appreciation is instead canceled out if new euros are printed. Since the newly created euros do just fall from the sky into everyone’s bank accounts, there would still be a redistributive effect due to the creation of money. In short, even if the two hypotheses disproved earlier were actually correct, we would still have to ask ourselves: who benefits from the creation of new money? Let us first see what monetary policies consist of and then understand their effects on the real economy.
1. HOW A MONETARY EXPANSION WORKS
1.1 The central bank’s “permanent” loan: a gift to the States

“it’s a fairy dust it doesn’t exist it’s never landed it is not matter it’s not on the elemental chart, it’s not fucking real” (Wolf of Wall Street)
The central bank creates money by lending at very low interest rates. The interest paid to the central bank for these loans, which amounted to €2.36 billion in 2019, is a net profit that is passed on to the national states that make up the European Union (the US Federal Reserve operates on the same principles). Although this interest is pure seigniorage income, in the style of “ancient feudal privileges”, these €2 billion certainly do not represent a sum that can change the macroeconomic situation of Europe. The big economic and social problem with fiat money is not the profit of the central bank passed on to the states, but the distortions to the market and the redistribution of wealth caused by the lending of money created out of thin air.
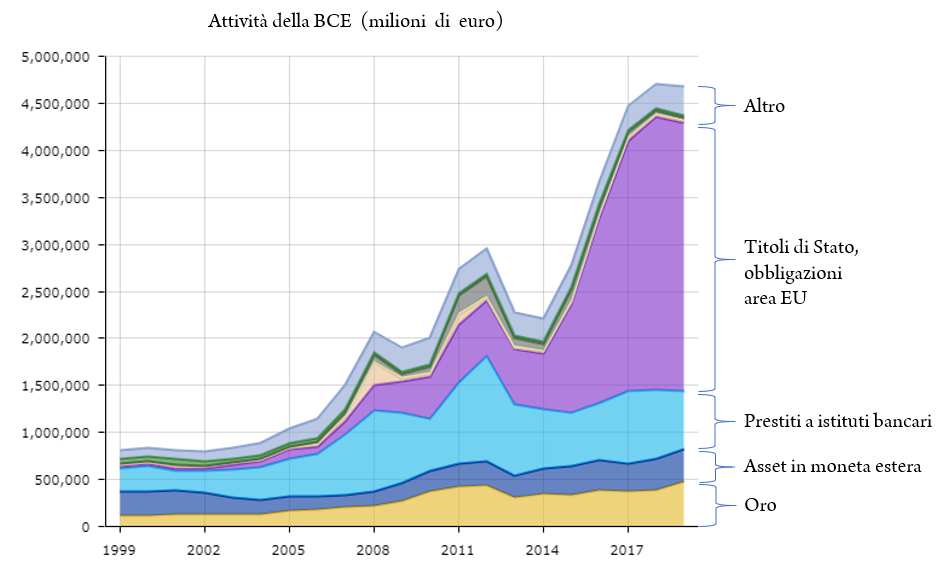
Liquidity injected through “main refinancing operations”[12], that is, credits made to banking institutions, increased exponentially year by year, until 2012[13] (The blue line in the graph below shows the maximum historical record). After that, they moved on to decidedly unconventional weapons: quantitative easing (in purple in the graph).[14]). The central bank’s assets corresponding to these two types of operations exceed 3 trillion euros, with a rapidly increasing trend.
In detail, refinancing operations with banks increased in particular in response to the 2007 crisis, with two significant tranches::
- 2008 Oct: 265 billion loans granted to banks
- 2009 June: granted loans of 442 billion in one month. This figure increases over the course of the year, reaching 614 billion[15].
However, the desired effect of relaunching the economy did not materialize. In response, in 2011, just after taking office, Mario Draghi announced the 1.019 trillion euro Big Bazooka:
- December 2011: 523 banks receive 489.2 billion euros
- February 2012: 800 banks receive 529 billion euros.
Out of 1019 billion, 453 billion was given so that it would act as a stimulus to the economy, while 566 replaced old debts, i.e., loans received by banks in previous refinancing operations[16]. About 325 billion was distributed to banks in Greece[17], Ireland, Italy and Spain so that they would cover their 200 billion in outstanding debts and have additional money, hoping that they would buy government bonds with that liquidity.
At this point, there is an important observation to make: a high percentage of the new loans are used by banks and states to repay previously contracted debts. In fact, those who obtain a loan, for every euro to be repaid to the ECB that is then “destroyed,” will receive a new euro as a replacement, plus an additional little incentive as a gift. The result is that the ECB’s policy is configured as a sort of “permanent loan” that is continually renewed and increased with euros created out of thin air. If the volume of loans continues to increase (and it has been so since the birth of the euro), we can say that ultimately it is a matter of money gifted, not loaned (remember that interest rates are very low, and in any case go to the european States as ECB profits).
However, the outcome of the main refinancing operations was not what Draghi had hoped for. Much of the liquidity injected with the Big Bazooka did not circulate at all in the economy. Banks feared that they would not be able to make the most out of the credit received and kept much of the funds in reserve: about 600 billion of the 1,000 received remained in the accounts that banks hold with the ECB.
It is normal to invest cautiously in sums received as a loan because losing them means failure. After being strucked by the crisis that began in 2007, banks were more cautious than the ECB hoped. Finding sufficiently safe investments to venture into is always difficult, but the risk increases greatly in the presence of already precarious balance sheets and a general economic crisis (itself caused by previous monetary expansions).
At this point, we know why the Big Bazooka did not bring inflation, despite injecting 1,000 billion into the economy over three months: simply put, about half of the amount disbursed remained in reserves, while the other half covered previous debt, which had already caused an inflationary effect in the previous years (remember that the loss of purchasing power since 2002 has been 33%, not exactly insignificant!).
If the previous debt had been repaid without resorting to new loans, there would have been a natural reduction in the quantity of money (monetary contraction), with a deflationary effect that would have cancelled out the inflation of the past years, bringing the euro back to its previous purchasing power level. Instead, the new loans have effectively replaced the previous ones, leading to a permanent increase in the money supply.
In addition to renewing debt with new debt, each wave of loans creates additional debt with the aim of inflating the economy. The central bank’s hope is to support public spending and stimulate bank lending to the private sector. However, banks are not so foolish as to apply the Keynesian wishes of the ECB like a university textbook, so they tend to maintain more risk-averse positions, bolstering their reserves rather than attempting uncertain investments. At that point, however, the mechanism designed by the crème de la crème of Keynesian researchers at the drawing board jams, and the central bank has to come up with something new to force banks to empty their coffers and pour credit into the economy.
1.2 Negative interest rates: how to empty bank reserves
In 2014, the ECB introduced negative interest rates (at 0.1%) on euros that banks deposit with the ECB for the first time. A deposit on the commercial bank’s account with the ECB is considered a “loan” to the ECB, which in the past generated a (positive) interest and therefore a profit for the commercial bank. In fact, the ECB created money out of thin air to pay this interest to the commercial bank. This is already a significant witchcraft, as it means creating wealth out of nothing and donating it to banks simply because they have a license granted by the authority and some money deposited in an account only they can open. Like a feudal privilege granting a rent. But of all the witchcraft they have come up with, negative interest rates are the icing on the cake.
To force banks to get rid of the money that the ECB has created, in order to inject it into the market, the central bank “taxes” the reserves of commercial banks by applying a “negative interest”. The rate gradually increased from 0.1% in 2014 to 0.5% in 2019[18]. This means that if banks keep money in their vaults, 0.5% per year is destroyed by the central bank. In this way, the central bank discourages banks from maintaining a reserve, discouraging prudent behavior and incentivizing risky investments.[19].
To understand negative interest rates, a clarification is needed. It is obvious that if a bank were authorized to keep its accounts as it pleased, it would never deposit values with the ECB where they are effectively taxed. But banks have very limited choices on how and where to hold “euros” (they are not bitcoin after all!) because euros exist exclusively in two forms:
- physical euros: banknotes, metal coins
- electronic euros: the latter exists exclusively as digital accounting in the reserve at the central bank. In fact, these electronic euros are interchangeable with banknotes because they are internal accounting at the ECB.
This means that a bank can hold assets denominated in euros, such as government securities, bonds, stocks, or in general credits of some kind (that is, value that someone owes to the bank), but it cannot hold real “euros” unless they are in a reserve at the central bank or in banknotes or metal coins.
The amounts denominated in euros that appear on our current or deposit account are not actually euros of our own, but an accounting entry that attests to the existence of a debt that the bank owes us[20]. A debt for the bank is a credit in our favor, so we can take advantage of this bank credit to pay, for example by transferring “1000 €” to PayPal. However, what we are transferring are not actual “money”, but only a “credit”, to which PayPal attributes a value in euros because it trusts the bank from which it comes, being registered with the public monetary authority. In short, PayPal expects that, upon request, actual euros can be demanded in exchange for that credit[21]. The M1 monetary aggregate, excluding its M0 component (monetary base in banknotes and reserves at the central bank), is in fact just a private accounting entry in the credit system.
For a bank, storing and transporting banknotes is a cost and a risk. You would have to store millions or billions of banknotes in a vault. But how much would it cost to transact those millions or billions in physical banknotes? This is why banks prefer to hold euros in electronic form in reserves at the central bank – even though they are constantly eroded by negative rates – rather than stack banknotes in bunkers.

Example of a bank transaction on the road (France, 2019) with military escort vehicles.
When dealing with increasingly high negative interest rates, the bank is faced with three options:
- Keeping euros in banknotes (with the related management and transfer costs)
- Keeping euros in electronic accounting at the ECB (with costs due to negative rates)
- Lending money, possibly even making a profit.
Obviously, the higher the negative rates, the more likely the bank is to want to get rid of the money by lending it. But in the absence of clients to whom to make safe and profitable loans, it is even convenient to sell the money and use it for activities that are not profits, but costs, provided that these costs are lower than the “tax” of the ECB! This is why commercial banks invented the negative interest rate mortgage: you take out a mortgage for your house and the bank rewards you instead of charging you interest. After all, it is better to offer the money to a client with a secure job (and perhaps an insurance policy on the loan), paying the client a small interest, rather than leaving the money at the ECB paying a higher interest rate (currently 0.5%).
1.3 Quantitative easing: privileges to parasites at the expense of taxpayers
In its Keynesian plan for “stimulating” the economy, the ECB has accompanied negative rates with an equally aggressive strategy: quantitative easing. Since January 2015, it has started to buy government bonds for 60 billion euros per month. In total, by the end of 2018, 2.5 trillion euros had been injected: the ECB buys government bonds from banks, which in turn buy them at auction from the states. Since the ECB’s program of monthly purchases is extended over time and not a single tranche, the States know that they will be able to continue to borrow by selling debt securities to banks, precisely because the banks will buy them regardless of the risk of the country’s bankruptcy. In fact, they can pass those securities on to the ECB, thus avoiding the risk that the debtor State will not pay in the event of bankruptcy. In this way, central banks finance States, with loans that end up turning into permanent credit provision, as they are continually renewed.
The central bank does not only buy the debt of national states, but also that of public or publicly held companies: from June 2016 to January 2019, bonds of companies worth 177 billion euros were purchased (the purchase program resumed in November 2019). In Italy, for example, the beneficiaries of the loans were Cassa Depositi e Prestiti (CDP) and Ferrovie dello Stato, both state-owned, plus the following publicly held companies: SNAM, of which over 70% of the shares are held by CDP and other institutional investors; Terna Rete Elettrica Nazionale, whose main shareholder is CDP; Enel, whose main shareholder is the Ministry of Economy.
The Bank of Italy, along with other central banks under the ECB umbrella, owns approximately 20% of Italy’s national debt. A remaining 40% of the debt is held by eurozone commercial banks, mostly Italian, which are incentivized to buy government bonds thanks to the liquidity injected by the ECB. Another 35% of Italy’s debt is held by extra-European banks, which are nevertheless subject to liquidity flooding by their respective central banks, which do not behave any better than ours. Ultimately, directly or indirectly, public debt is fueled almost exclusively (95%) by the monetary and financial system imposed on us by the states.
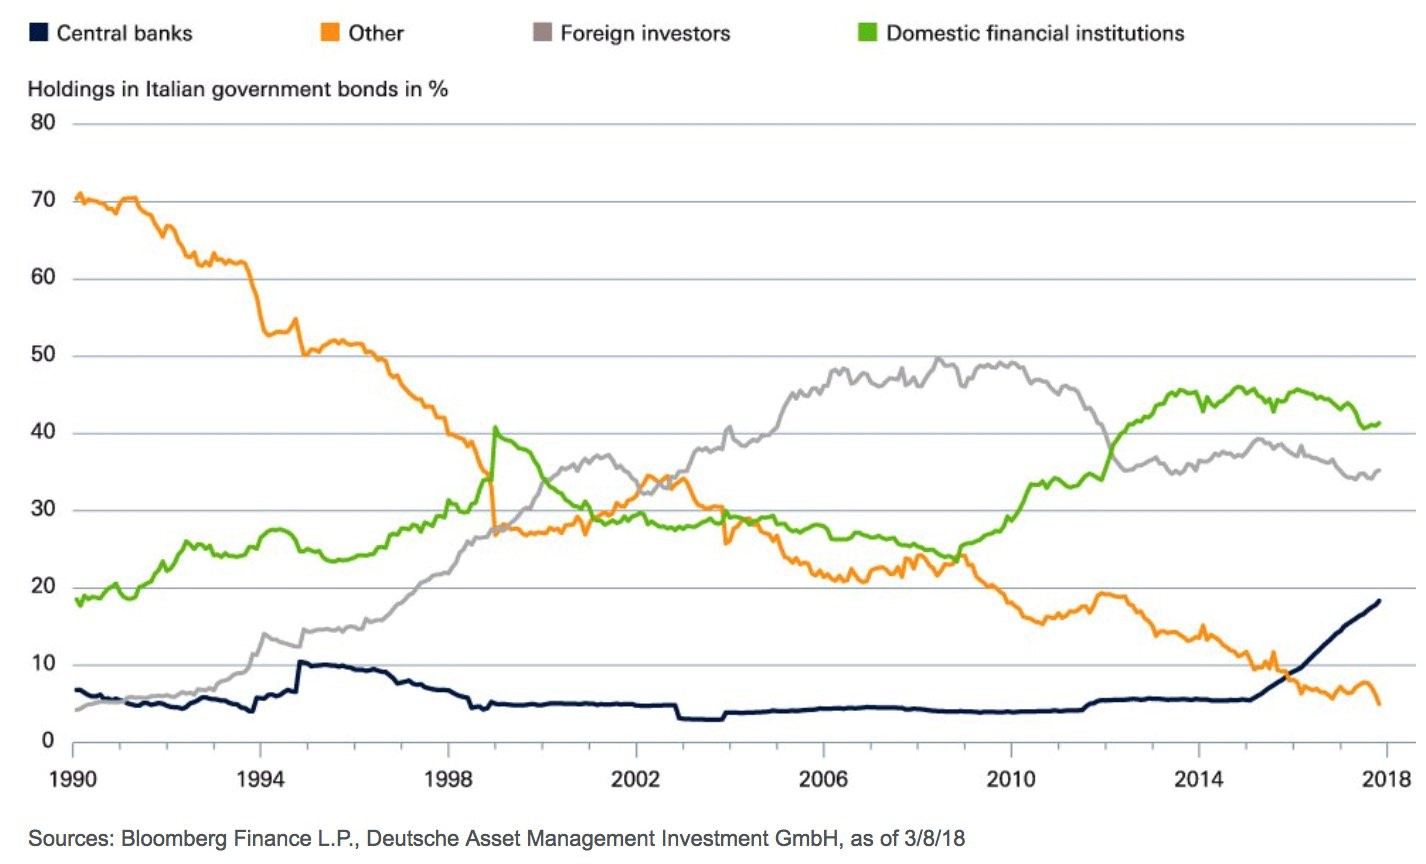
In the graph, it is evident how the percentage of Italian government bonds held within the banking system is significantly increasing over time.
Without institutional buyers, it is unlikely that anyone would still purchase government bonds: lacking a central bank that can generate money out of thin air to support it, investors would view the government similarly to a private company. However, few would buy a bond from a private company that has had a negative balance sheet [22] for 95 years and at the same time a debt that is roughly three times larger than its annual revenues. Such a company would have failed immediately, while the government only survives thanks to coercion: taxes and the imposition of a monetary standard. Private individuals who still purchase government bonds do so exclusively because they trust that such a coercive system will not fail even in a situation of total crisis. In fact, historically, we have seen that rather than disintegrating, repudiating debt, or declaring bankruptcy, States have torn the economy to shreds. At that point, if one must invest, perhaps it is better to do so by betting on the big bad wolf rather than any of the grazing cows (successful companies), which can be preyed upon at any moment[23]. A fiscal policy of the State as aggressive as the one we are experiencing today cannot ignore the monetary policy.
2 THE EFFECTS ON THE REAL ECONOMY
After clarifying the mechanisms that lead the central bank to finance national states through the banking system, we finally get to the heart of the matter: do these monetary policies cause harm? Beyond the mere change of numbers in a database or accounting ledger, we must understand the actual consequences on the behavior of flesh-and-blood people who work and give the fruits of their labor to others.
2.1 Hidden inflation: the cost of the public sector
In a nutshell, the monetary policies we discussed see three stages:
- The ECB buys government bonds, financing the State. This happens more directly through quantitative easing, and indirectly through conventional policies (LTRO, etc.). Afterwards, the ECB covers this debt with new loans at very low interest rates, effectively turning the amount lent into a gift[24].
At this stage, there is still no interaction with the real economy, only some changes in the figures in accounting databases.
- With the funding obtained, the state covers the costs of the public sector (public administration, schools, health, police, etc.) and pays pensions.
Again, the only thing that has happened is a monetary transfer (purely accounting), so still no effect on the “real” economy. Finally:
- Public employees (or those of publicly-owned company) and retirees under State pension schemes buy with the money received goods and services on the market[25].
In this third phase, the impact on the real economy finally takes place: there are people in the private sector who work and with the sweat of their brow produce goods and services, which are sold to state employees in exchange for money “created out of nothing”. It is on this stage that we must focus our analysis.
In theory, many of those government employees do not receive goods and services from private entities without giving anything in return, because they provide a public service that should benefit everyone. The problem is that the balance of payments between private and public entities has one visible plate, whose value is measurable in terms of price per quantity of what the private entity gives up, while the other plate, representing what the private entity receives, remains hidden. The costs of the public system are well quantifiable and measurable, but the benefit they bring is not equally quantifiable, since there is no market pricing system that determines the value of the public service. And as Hayek teaches, if there is no price, there is no information.
the value of what a market economy produces can be measured, albeit to a good approximation. How much the state offers, on the other hand, cannot: lacking a price system, it lacks information (Hayek). The only thing evident is rising costs and spending. But against what benefits?
For every injection of liquidity, the government and its employees can purchase more from the private sector, but we do not have a measure to know whether, in exchange, the private sector will receive more from the public sector. In other words, has the ECB’s financing of the states resulted in better service for the private sector? If not, then there is a clear distortion, which is not “inflation” of consumer prices relative to the euro, because it does not appear in the statistics of statistical institutes, but it is very close to it, because it is still a loss of purchasing power.
The price of a McMenu has not increased much in recent years, so we can still afford it by working the same number of hours as before, whether we work well or not. On the contrary, the funds allocated to the public sector have increased despite public services not improving or even deteriorating, so we have to work harder to obtain a service that is at least equal to what it was before the monetary expansion. There is thus a loss of “purchasing power” with respect to goods and services covered by the public sector. In the long run, this dynamic harms the economy and thus also the public employees themselves, contributing to a general impoverishment.
Let’s consider healthcare, which is a hot topic in the Covid-19 era: public healthcare spending in Italy has increased in absolute value by 45% from 2002 to 2018, from about 80 to 115 billion euros[26].
At the same time, the share of payments not covered by the National Health System, but charged to patients, increased from 21 percent to 23.5 percent (from 2009 to 2017). Between 2006 and 2017, the number of hospital beds per capita fell by 30%, from 3.9 per 1,000 population to 3.2[27]. We had 1321 hospitals in 2000, they became 1063 in 2017[28]. To make a long story short, we pay twice as much for the same service today as we did 15 years ago[29], but there is no trace of this change in the inflation index reported by eurostat and ECB, because what is public is not calculated by the index[30].
Healthcare is just one example, but the public sector covers a huge portion of the economy, over 45% of the entire national production in Italy. That is why the devaluation of the euro relative to public services such as healthcare, security, education, transportation or roads, has a central role in determining our spending power. From 2002 to 2017, nominal GDP grew by 17.55% (real GDP, net of inflation, declined), while tax revenues grew by 62.44% (from € 323 to € 556 billion). In other words, the cost of the state has increased disproportionately to the services offered, but the inflation index of consumer prices (HICP) does not take this into account. This explains why the inflation of consumer prices has not increased much.
Those who do not agree should look at today’s expenditure of the public administration[31](below is a comparison of some entries between 2002 and 2018) and try to remember their life 15 years ago. Do the services that the Italian State offers today seem to have improved proportionally to the costs? Or, on the contrary, in some cases, have they even worsened, despite the availability of better technology and increased funds?
| Expenditures per area (milions €) | 2002 | 2018 | % increase |
| Welfare (social policies) | 219.327 | 366.857 | 67,26% |
| Healthcare | 84.354 | 120.911 | 43,34% |
| Healthcare (detail): public hospitals | 36.547 | 50.017 | 36,86% |
| Education | 59.934 | 69.829 | 16,51% |
| Law enforcement and security | 25.632 | 32.483 | 26,73% |
| Transports | 25.681 | 29.558 | 15,10% |
| Army (“Difesa” in italian) | 15.477 | 22.117 | 42,90% |
| Environment | 10.523 | 14.808 | 40,72% |
| Broadcasting and publishing services | 270 | 2.649 | 881,11% |
| Street lighting | 924 | 1.996 | 116,02% |
The heaviest entry in absolute terms is welfare, which costs almost 70% more than before. But it is interesting to note some minor items such as spending on “very useful” broadcasting and publishing services, which is almost nine times larger than before. This is certainly a good indicator of the freedom and independence of Italian media. Also noteworthy is the increase in spending on street lighting, which has more than doubled, especially considering the technological advances that have been made, which in theory should make things more efficient and therefore reduce costs (such as the more recent LED technology[32]).
In conclusion, we can say that a first effect of monetary expansions is the loss of purchasing power compared to goods and services covered by the public sector. This redistribution of wealth is detrimental solely to those who produce and support the State, and therefore has an even more insidious effect than inflation of consumer prices, which at least is a phenomenon that negatively affects anyone who has savings in fiat currency, regardless of their social class (consumers or taxpayers).
2.2 Consumer price inflation: you don’t see it but it hurts
We have seen that the effect of monetary expansions on inflation is “mitigated” by the fact that the funds are absorbed by the public sector, so there are no prices to track in official inflation indices. Net of this effect, the created monetary mass is still so vast that it inevitably has its effects on the private market, and therefore on quantities directly measurable by traditional statistical institutes.
After the money has been spent by the public sector and begins to circulate in the economy, the monetary mass increases compared to the circulating money, and therefore inflation grows. Although it is a well-known effect, few people stop to think about the medium and long-term consequences. The 2% annual inflation rate may seem harmless, but it is only seemingly so. At this rate, with 100 euros today, which we can use to buy, for example, 100 sandwiches, in 20 years we will be able to buy only 66 sandwiches. The money we save and set aside, for example for pension purposes, will be practically halved when it comes time to enjoy it.
However, the fraud is even more visible when we analyze the details. The purchasing power of money is calculated on a weighted average of all the goods in a reference basket, including electronic goods, computer services, telecommunications, and other sectors that have seen strong technological progress and sometimes liberalizations in recent years, with a resulting and beneficial fall in prices. The consumer is obviously satisfied if the price falls, especially if at the same time the performance increases: a smartphone that two years ago was a top-of-the-range model for 1,000 euros now costs less than half. As the ECB data shows[33], among the most successful and deflationary markets in recent years are information technology, communications, electronics and others.
| Deflationary sector | Deflation % 2015 – 2019 |
| Communications | 5,14% |
| Apparel | 7,95% |
| Audio, photography, information (pc, software etc.) | 7,84% |
| Ricreational activities, culture, holidays | 15,02% |
The deflation occurred despite the fact that monetary authorities aim for the opposite goal, that is to appreciate goods in the economy rather than depreciate them. Indeed there are sectors that appreciate more than 2% annually to dampen the beneficial (deflationary) effect of technology, mantaining the 2% average inflation rate:
| Inflationary sector | Inflation % 2015 – 2019 |
| administrative burdens | 22% |
| food | 6,94% |
| transports | 6,86% |
| charges from banks and post offices | 10,76% |
| water, electricity, home maintenance | 5,7% |
| nursing homes | 7,43% |
| restaurants, hotel | 7,52% |
| Insurances | 7,93% |
| alcohol and tobacco | 13,25% |
We can notice that the list of the most inflating goods includes essential services and basic necessities such as food, water, and electricity, which benefit less from technological progress. Often this is because they are limited sectors regulated by the public authority, or because they are goods and services that cannot be imported from foreign countries that are freer than ours (which can produce at lower costs).
If there were no creation of new money, all sectors would tend to be deflationary (with the exception of those costs of the State that are included in the calculation of the HICP, such as administrative burdens that cost 22% more than five years ago[34]), while those already deflationary today would be even more so. Deflation means that cach one of us, year after year, would get richer benefiting of the technology.
2.3 From savers to speculators: how central banks create financial bubbles
The long-term devaluation of currency destroys the monetary value of savings. For this reason, in the presence of inflation, we are encouraged to consume immediately rather than save and delay consumption. Devaluation is part of the precise Keynesian-inspired design underlying the actions of central banks, according to which an institutional intervention that supports consumption is necessary to give a boost to the economy.
Despite the crazy beliefs of the bureaucrats at central banks, there is no magic spell that makes consumer goods available by printing pieces of paper with “euro” written on them. The only possible option is to consume accumulated capital (savings). And it is here that the hyper-consumeristic Keynesian doctrine and the Marxist doctrine bizarrely come together, with the difference that at least Marx had the ultimate goal of “liberating” the individual (epic fail), while for Keynes individuals must remain at the mercy of his dirigiste theories[35]. Whether for one doctrine or the other, the aversion to capital accumulation has become so deeply rooted in many Western societies that it has taken on moral, almost religious connotations. Yet, saving is fundamental for a healthy economy, for two reasons:
- It is a “reserve” that allows us to cope with crises, unforeseen events, and accidents.
- It allows investment in capital goods (means of production, education and know-how, etc.), improving productivity and efficiency in the long term, thus stimulating progress.

Saving is not sufficient, but necessary, condition for economic growth and progress. It is not so intuitive to understand why postponing consumption can lead to investment in capital goods. We could aulically cite Solow’s growth model (which oddly enough is even studied in public universities around the world[36]), but a simple example is sufficient to understand its mechanics.
If a fisherman consumes all his supplies, he will necessarily have to fish the next day to survive. In case of bad weather, if he cannot fish, he may even suffer from hunger. If, on the other hand, he saves, in addition to ensuring a meal in case of a storm, the next day he will face two new options:
a) Laziness: the fisherman can consume the saved fish, not work and enjoy a nice day of rest.
b) Investment: the fisherman consumes the savings of the previous days, but not having to fish, he uses the free day to improve and expand his activity, for example by building a new net. Alternatively, he could still go out to sea, but sell the catch of the day to the carpenter in exchange for his work in improving the rudder or winch.
Saving is not a sufficient condition for investment, because as we have seen, the fisherman could simply choose to postpone consumption for the sole purpose of resting the next day and not doing anything productive. However, it is an absolutely necessary condition: without savings, there is no investment.
When the fisherman chooses to use his savings to buy new fishing materials, he not only can be more efficient and productive, but also contributes to shifting market demand towards capital goods (such as nets or boats), thus encouraging producers of those tools to develop better technologies. The resulting ripple effect produces economic and social progress. On the other hand, a society that discourages saving is a society that slows down progress.
One could object to this theory by claiming that nowadays, very few of those who intend to accumulate long-term savings, for example for pension plans [37], are really aware or concerned of the problem of inflation. Everyone entrusts their capital to financial intermediaries who make the received sums yield, compensating for inflation. This function of the financial intermediary is important, but the problem is that investment today is no longer a choice, but a necessity to save one’s savings. This is a forced deviation from the natural dynamics of the economy, the result of which is an excess of credit poured into financial markets. In short, it is no longer possible to save in the long term without entrusting one’s money to third parties.
The farmer with 200 hectares of land struggles to make ends meet, despite producing for half the nation, while the bank in the city center has marble floors: it is clear that the weight of the intermediary is excessive compared to the actual wealth producer. The reason is that if savings are completely managed through banking channels, they become the subject of speculation in financial markets.

Excuse me for not explaining it as Margot Robbie does
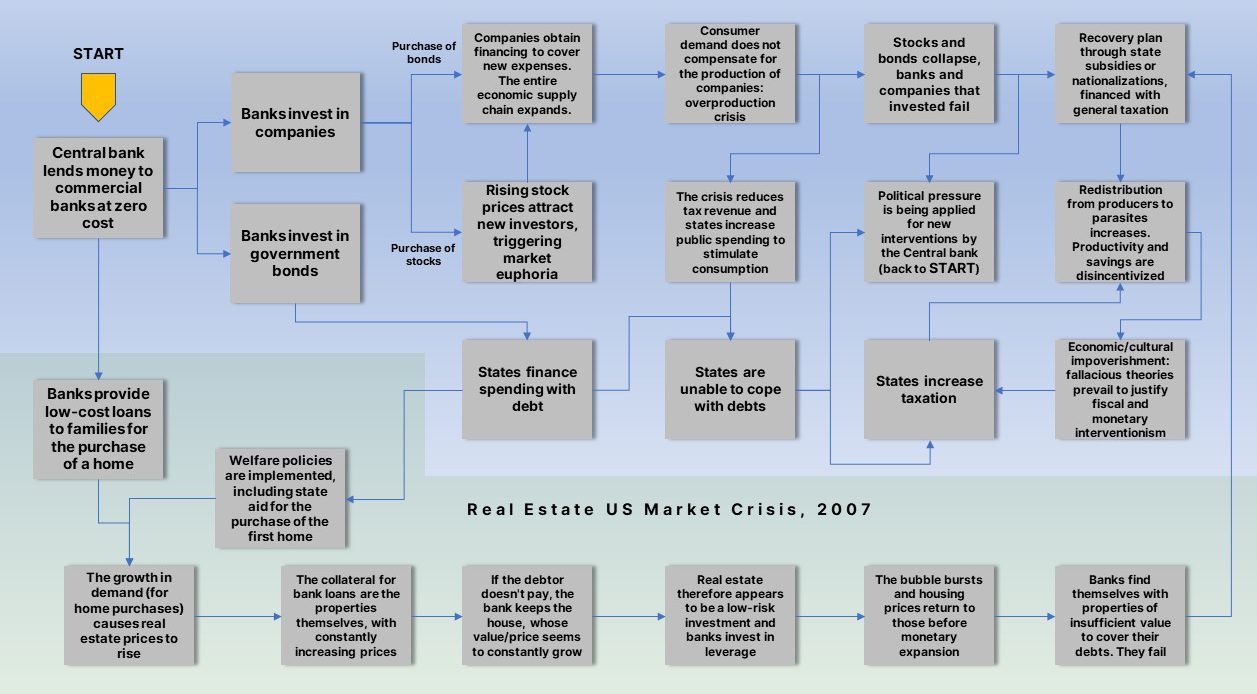
Banks effectively take ownership[38] of the capital under management and multiply it through the fractional reserve mechanism [39]. When investments go well, it will be the big players in finance who will benefit and stock market indices will rise in a full-blown bubble. Euphoria will lead to poor investments and eventually to overproduction not compensated by actual demand. When the bubble bursts and financial markets collapse, it will be the State that intervenes with aid, bailouts, and nationalizations, while the humble farmer will bear the consequences, burdened by the general taxation that finances the state intervention (according to the dynamics described in the infographic in chapter 2). A future article will be entirely dedicated to the topic of fractional reserve banking, so there will be no further discussion of these issues here.
2.4 The idiocy of competitive devaluation
Among the various justifications for inflationary policies that bureaucrats, politicians, and pseudo-economic scientists have come up with, there is also “competitive devaluation”. This is a strategy that would justify printing more money – compared to what other nations do – under the pretext of favoring domestic products on the foreign market. It’s such a stupid idea that one should wonder why human civilization hasn’t completely overcome and buried it in history books yet.
Even if we were to admit that there should be a central planner for national economies, a social objective cannot be to sell as much as possible abroad; rather, the goal should be to be able to buy as many goods as possible from abroad. Selling only for the sake of selling means working here for the benefit of those who, abroad, enjoy the fruits of our labor. Selling makes sense only if we get something in return. If we devalue our currency compared to foreign currency, the first result we obtain is that we will be able to buy less from abroad, meaning our savings will allow us to enjoy less of the work of others.
Producing at lower costs than other countries, so as to sell more easily abroad, is a matter totally independent of the currency used. If we really had a comparative production advantage in a certain sector due to technology, know-how, efficiency, or atmospheric conditions, we would be able to produce a certain good at a lower cost and effort than what they do abroad. Since abroad they will attribute a higher value to that product compared to the effort we make to produce it, they will be willing to offer more to have it, thus enriching our local producers.
If, on the other hand, we sell that particular good abroad not because we are better at producing it, but only because we devalue our currency relative to foreign currency, it means that we are implementing a welfarist measure that allows the producer of that particular good to export it abroad, but to the detriment of the rest of the population: anyone who consumes foreign goods is disadvantaged, as are all producers who use imported labor, capital goods and services[40].
Those producing goods for the export are selling to foreign markets not because they have a real competitive advantage, but only because the currency has been devalued, if exchange rates were to change for purely political reasons, that producer may not be able to export and could fail overnight (as would companies in the entire production chain). Monetary policy thus adds new factors of uncertainty and risks for producers, which add to those due to fiscal policy and tariffs, another great enemy of humanity. It is the sad story of a world where investments and resources are wasted simply because goods have to cross imaginary border lines.
As Saifedean Ammous reminds us in his book “The Bitcoin Standard,” devaluing our money means turning it into “easy money” that allows other countries to “plunder” us, much like Europeans did to colonized countries in the past. For example, shells used as currency by Native Americans [41] could be fished cheaply by Europeans making use of large boats and deep-sea nets. They were of little value to Europeans, who used them to acquire valuable resources and wealth from those who did not understand the true nature of money. In short, devaluing one’s currency means selling out one’s labor.
4. HOW COULD WE ACCEPT THAT
From a cultural perspective, increasingly invasive fiscal and monetary policies[42] have held up in recent decades without particular opposition from the public, probably for four reasons:
3.1 The “boiled frod” effect
The tax burden and inflation are gradually increasing and the ‘boiled frog’ effect (frogs stay in the water that warms progressively until it kills them) has made such policies more acceptable. If rebelling can cost you everything, is it better to accept a little more deprivation, among the many you already suffer?
3.2 Tiranny of the majority
(most of the examples here are about Italy. I am pretty sure other europeans can find similarities with their country, while I bet that americans aware of these facts might be able to better predict their own future)
Most voting citizens are not producers but “consumers” of wealth. Looking for example the personal income tax (IRPEF) in Italy, 87 percent of tax revenue is paid by only 16 million people[43] out of a population of 60 million. All people in the IRPEF brackets up to 20 thousand euros (so 24 million out of 40 million taxpayers) do not pay enough IRPEF even to cover their health care expenses[44]. Pensioners then number 16 million, all of whom are now dependent on the State. Even if they worked in the private sector and thus were “payers” and not “consumers of taxes”, they have been forced to surrender contributions for years instead of redirecting those funds to a private savings system. The Italian National Pension System (INPS) does not accumulate funds or reinvest them in financial markets, so nothing remains of the contributions made. The public welfare system has made yesterday’s workers now suckers attached to State breasts[45].
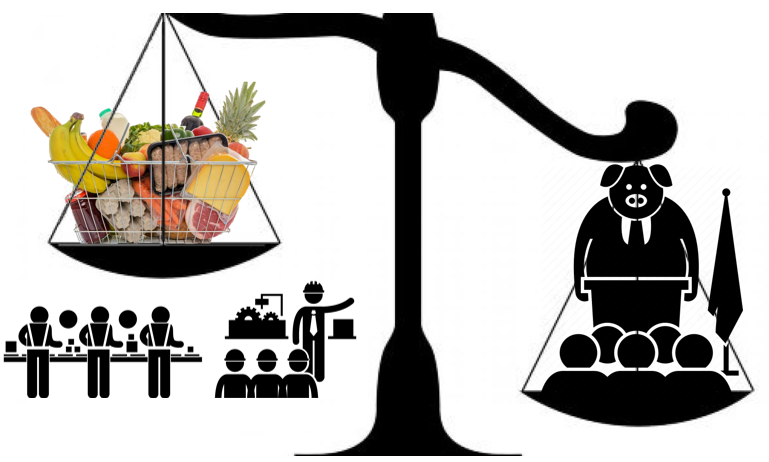
Since every head is worth one vote in the voting booth, which is not weighed based on the census (taxes paid) [46] , it is clear that “wealth consuming people” (“consumers” of taxes) have a greater weight in determining government and parliamentary decisions, effectively creating a classist situation: a parasitic majority tyranny consuming wealth produced by the actual workers. From an age perspective, Italy is in one of the worst situations, but in general, all social democracies are on a curve tending towards the abyss.
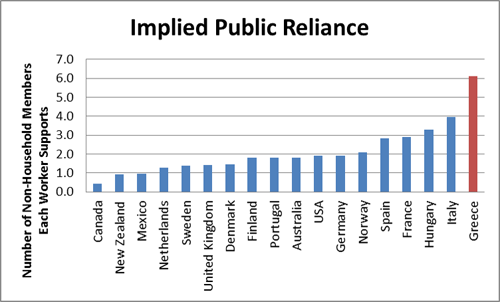
In the graph, the number of people outside of their own family unit that each worker supports through their taxes
There is also a second dynamic, in some ways opposite to the tyranny of the majority, that characterizes the modern State: once it is established that the public apparatus has the power to intervene in a certain area, it is inevitable that, through a clear mechanism of incentives now internationally recognized by political scientists, situations of lobbying will arise in which politics tends to benefit a small group at the expense of many (pork-barreling). Subsidies to a specific sector or category allow the current politician to create consensus among that segment of the population, while the increased costs with which they are financed are spread across the entire population and therefore, in the short term, do not cause any damage to the supporters of those policies.
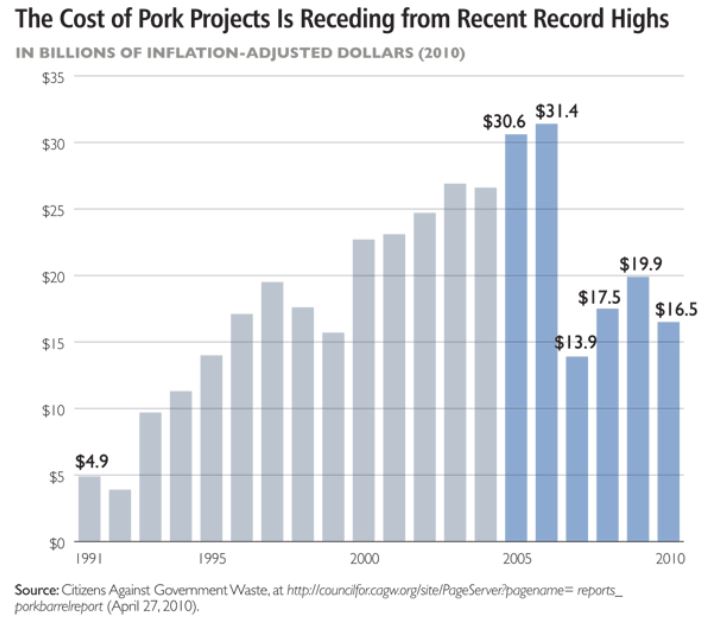
The ever-increasing costs of “earmarks,” which are clauses inserted into budget laws or other provisions that provide some privilege or favoritism through the allocation of new funds (here, the example in the US from 1990 to 2010).
3.3 Ignorance and ideology
Citizens do not understand economics (especially those with a degree in economics), while the political and journalistic world does not provide a transparent narrative of the dynamics that led to the increase in tax pressure and public debt, and therefore economic crises. The Keynesian culture that permeates the academic world, which is ultimately just a variant of Marxism that makes greater use of econometric models, instills its statist justifications in the fresh minds of young people and demands more and more state intervention to combat contemporary problems generated by the state. One example of this is the common narrative that the 2007-2008 crisis, from which we have never fully recovered, was due to turbo-capitalism and the lack of control in the financial world. Another common cognitive distortion is the attribution of all contemporary problems to a period of “madness” between 1970 and 1980, when public debt supposedly grew, condemning new generations. However, it is not understood why today’s “new generations,” who in theory should be victims, are acknowledging the same policies as their fathers (indeed, worse), thereby qualifying themselves as perpetrators [47].
3.4 The veil of progress
Despite the fact that the “Great Parasite”, the leviathan, has kept an increasingly larger share of the fruits of our labor year after year, for much of the last few decades, everyone’s standard of living has steadily risen due to globalization and technological innovation. Paradoxically, the great gift of the free market, the technological progress, could be among the main factors that have limited awareness of how much harm is done by the State.
CONCLUSIONS:
In the article The Birth of Fiat Money we have explained why, historically, deflation has been seen as a bad thing around the end of the 19th century, and how the injection of liquidity was identified as the cure for a sick banking system at the beginning of the 20th century. We have also seen how these interpretations of the economy were wrong and the disasters they caused or contributed to, from Roosevelt’s New Deal (which the State school still promotes as a positive event, instead of a series of criminal acts) to Hitler’s rise.
Despite the damage caused, the problem of inflation has never been fully understood by politicians and economists (mostly Keynesians), nor has it been properly fought. The lira lost 97% of its purchasing power in fifty years after World War II, while the dollar lost 97% a little more slowly, in about a century. Today, some believe that inflation is no longer a problem and that central banks act responsibly, but as we have seen, this is only an illusion.
Monetary expansions give States spending power because they can always count on debt to finance themselves. This entails a redistribution of wealth from private to public sectors. Inflation is, in effect, a tax that discourages saving, and therefore investment and progress. Saving necessarily requires handing over one’s money to third parties to avoid devaluation. Capital then flows into financial markets, causing bubbles and boom-and-bust cycles. And during the “covid emergency” (let’s call it that way…), the Fed has already lent 2.3 trillion to State and local governments, buying debt securities [note: this article has been published in may 2020]. More than what was injected to deal with the 2007-2008 crisis.
While the evil Sith order perpetrates its deceptions, some brave Jedi knights on May 11, 2020, mined bitcoin block 629,999, the last one before the third halving, inserting a text in the coinbase of the block echoing Nakamoto’s genesis block: “NYTimes 09/Apr/2020 With $2.3T Injection, Fed’s Plan Far Exceeds 2008 Rescue”. One day, humanity will forget what the Federal Reserve was, but that message will remain forever in the Bitcoin blockchain, as a warning for those who will try it again in the future. And when your great-grandchild scans the blockchain and reads that bizarre message, he or she will come to your bedside, intrigued, and ask. And you, with a tear of pride, will tell him or her the most beautiful story: how in life, you fought, in your own small way, to make humanity progress.
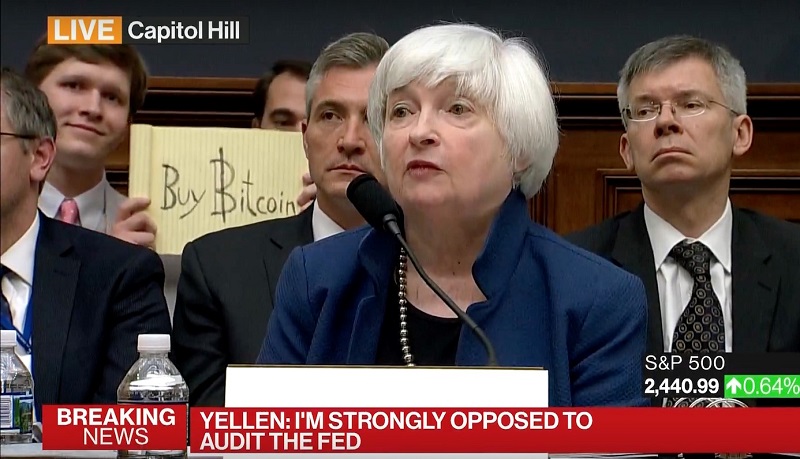
A brave Jedi knight peeps into Congress as Yellen says she opposes an audit of the Federal Reserve’s performance (Janet Yellen was Fed Chair until 2018)
ANNEX AND NOTES/REFERENCES ARE NOT TRANSLATE YET
ANNEX: FOREIGN DEMAND FOR EUROS
We have very precise data on banknotes entering and leaving the eurozone. At the end of 2017 the value in banknotes held abroad amounted to 162.5 billion (13.9% of the total value in circulation)[48]. Moreover, since 2015 the trend seems to have seen a partial reversal, with banknotes returning to the eurozone rather than being taken abroad[49]. Two-thirds of banknote movements to and from abroad are for shopping needs and tourism. Only a third of the movements could be attributable to hoarding needs, i.e. the use of the euro as a reserve[50].
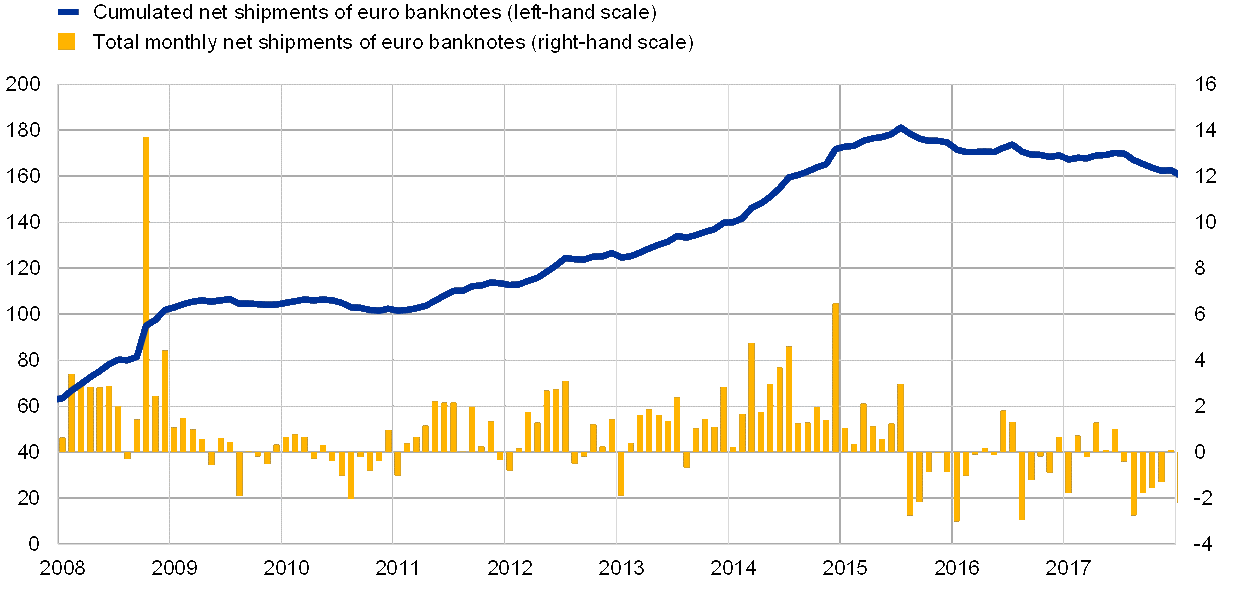
banknotes (euro) sent or returned from abroad over the years
As far as forex reserves are concerned, in 2002 23.65% of the reserves held by states worldwide were in euros[51], today they are 19.2%[52]. Although the euro has lost as a percentage of the total, in absolute value the euros held abroad have increased enormously. Nothing to do with the amount of money created, however. In fact the total forex reserves amount to an estimated 12,730 billion dollars[53] of which we said 19.2% in euros, which at the current exchange rate from the dollar is about 2,300 billion. Very little compared to the 9 trillion euro of M1 existing today, even less if we consider broader monetary aggregates (m3 is close to 12 trillion euro, and we have to consider that forex reserves include banknotes, deposits and also government bonds of all kinds, so they fall under the broader definition of m4[54]).
[1] To be precise, the state mints under the hat of the ECB
[2]https://www.ecb.europa.eu/stats/policy_and_exchange_rates/banknotes+coins/circulation/html/index.en.html
[3] In addition to money in physical form and the electronic form of current accounts, M1 includes other forms of immediately spendable value, such as bearer cheques. In general, it represents those forms of value that can be disposed of immediately and without cost, and that do not generate any kind of return. It does, however, include interbank overnight deposits, which actually pay an interest rate, even if it is accrued in just 24 hours.
[4] Historical series graph euro M1: https://fred.stlouisfed.org/series/MYAGM1EZM196N
[5] https://www.ecb.europa.eu/pub/annual/balance/html/index.en.html
[6] Let us assume that we live in a presitoric tribe representing a closed economic system where there are only 10 coins, 5 furs and 5 cows. Let us also assume that no one has any particular preference for a fur coat or a cow, which are valued by everyone as being of equal value. Since there are 10 coins with which to exchange the two goods mentioned, the relative value of each good in the economy is as follows:
1 cow = 1 fur; 1 cow = 1 coin; 1 fur = 1 coin.
However, if the amount of coins is quadrupled by the tribal chief (the banking system), we will have 40 coins in the economy. By the time the tribal chief has spent his coins (or at any rate by the time the tribe members become aware of the increased supply), it will be clear that 1 cow and 1 fur coat will be worth far more than 1 coin. If they were still worth 1 coin, with 10 coins you could buy all the goods in the economy and the remaining 30 coins would be worthless. If coins by definition must all have equal value, inevitably the relative prices of goods will become:
1 cow = 1 fur; 1 cow = 4 coins; 1 fur = 4 coins.
[7] See the table with the details:
| Loss of purchasing power of the euro over time | ||
| Year | Average annual inflation* | Loss of value compared to 2001 |
| 2002 | 2,50% | 2,50% |
| 2003 | 2,70% | 5,27% |
| 2004 | 2,20% | 7,58% |
| 2005 | 2,00% | 9,74% |
| 2006 | 2,10% | 12,04% |
| 2007 | 1,80% | 14,06% |
| 2008 | 3,30% | 17,82% |
| 2009 | 0,80% | 18,76% |
| 2010 | 1,50% | 20,54% |
| 2011 | 2,80% | 23,92% |
| 2012 | 3,00% | 27,64% |
| 2013 | 1,20% | 29,17% |
| 2014 | 0,20% | 29,43% |
| 2015 | 0,00% | 29,43% |
| 2016 | -0,10% | 29,30% |
| 2017 | 1,20% | 30,85% |
| 2018 | 1,10% | 32,29% |
| 2019 | 0,60% | 33,08% |
| 2020 | 0,40% | 33,61% |
*annual average consumer price inflation, re-evaluated from ISTAT data
[8] In this article we will use the term ‘inflation’ as generally understood by the Keynesian and monetarist school, i.e. as the loss of the purchasing power of money relative to a basket of goods, this definition having now improperly become the most accepted. A more rigorous definition would instead be that of the Austrian school (e.g. L.V. Mises), for which inflation is more simply the increase in money supply.
[9] https://fred.stlouisfed.org/series/CLVMEURSCAB1GQEA19 real GDP rises from EUR 2,174 billion in the first quarter of 2002 to EUR 2,683 billion in the first quarter of 2019, with the 2010 euro as the nominal reference value.
[10] That 23% may be an overly optimistic figure. Different estimates can be obtained by looking at this figure in absolute dollar terms: https://tradingeconomics.com/euro-area/gdp, from $7,174 billion to $14,000 billion in 2019. Apparently a doubling, but this increase is measured in dollars, and the dollar has inflated over the same period (relative to the US domestic basket of goods) by 44%, so it would have lost almost 50% of its purchasing power. In short, inflation-adjusted GDP growth would have been very limited across the eurozone. Indeed, if we look at the Italian figure for example, GDP is now roughly the same as it was in 2002 (all the data in this article stop in February, pre covid-19).
[11] In the inflation calculation, a small increase in GDP could only compensate for a large increase in the quantity M of money if the speed of trade increased (V in the equation: GDP = V * M according to the quantitative theory of money). But the speed of trade has steadily decreased since 2008: https://fred.stlouisfed.org/series/M2V. In any case, it would be absurd to assume an increase in V such that it could compensate for the 4-fold increase in M, when GDP has increased by just over 20%..
[12] Long Term Refinancing Operations o LTRO,
[13] https://en.wikipedia.org/wiki/European_Central_Bank
Hans-Werner Sinn, The Euro Trap: On Bursting Bubbles, Budgets, and Beliefs, 2014, pp 154-155
[14] source: https://www.ecb.europa.eu/pub/annual/balance/html/index.en.html
items in the graph explained at pp. 24: https://www.ecb.europa.eu/ecb/legal/pdf/celex_32016o0034_en_txt.pdf
[15] Programme announced in May, lasting 12 months
[16] Also included are loans taken out by banks on the private market
[17] In 2012, Greece obtained EUR 121 billion to cover its debts (SMP programme). The interest rate paid for those loans by Greece generates considerable profits for the ECB, which are passed on to the nation states. Following some protests, the profits are then reimbursed to Greece.a
[18] https://www.ecb.europa.eu/stats/policy_and_exchange_rates/key_ecb_interest_rates/html/index.en.html
[19] Contrary to what one might think, central banks have never played the role of restraining the worst speculative instincts of supposed banks and supposed financiers bent on greed and profit, as would be portrayed in some Marxist fable. On the contrary, the minimum reserve ratio ‘imposed’ on banks has always been lower than the banks themselves were willing to risk (in the European Union it has always been between 0 and 2 per cent, when banks hold on average 10-15 per cent in reserve). Negative rates are nothing more than an incentive to move closer to the minimum allowed. In the USA, with the extraordinary occasion of the covid-19, the FED raised the fractional reserve ratio to 0% for the first time in history.
[20] Article 1834 of the Italian civil code (similar laws can be found in most western states) specifies that the money deposited in the account is the property of the bank, so the ‘credit’ the customer has is effectively a ‘credit’, not euro property. The bank is obliged to return the money, but ‘with observance of the notice period established by the parties or by custom’, as the civil code states.
[21] In reality, there are neither enough banknotes in the banks’ coffers nor euros in the reserves at the ECB to repay all the credit/debt in circulation, but this is another matter that we will go into later when discussing fractional reserve banking.
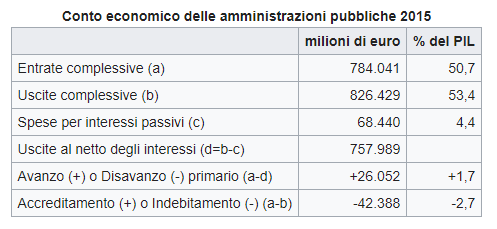
[22] 1925 is the last year in which there was a breakeven. In 2020 pre-coronavirus, GDP is $2,084 billion and debt is close to $2,500 billion (134% of GDP). Revenues are consistently lower than expenditures, which are burdened by some 70 billion in interest expenses on the debt. Here is a summary table with 2015 data:
[23] In the book ‘The Bitcoin Standard’, Saifedean Ammous explains well how states had far less spending power before they gained total control of the currency, only achieved in the 20th century, the century of totalitarianism.
[24] The low interest that the state pays for those loans is a profit of the ECB passed back to the states themselves (net of costs, mainly personnel, of the central bank). So, to a certain approximation, if the loan is really renewed indefinitely, one can really speak of money given away.
[25] In addition to these parties privately purchasing on the market, the public sector also sources materials that it buys on the market (e.g. asphalt to produce roads). There is also a ‘real’ effect in the relationship with suppliers.
[26] In absolute value, from €79.974 billion in 2002 to €115.410 billion in 2018 https://www.statista.com/statistics/793788/public-healthcare-expenditure-in-italy/. The population has increased by about 5%, so it does not justify such an increase in healthcare spending. In particular, the bulk of the increase occurred between 2000 and 2008, since in the subsequent crisis period spending increased much more modestly: from €2,225 per capita spending in 2010 to €2,326 in 2018 (+4.5%). This is still an increase, despite the fact that Italian GDP fell over the same period.
[27] https://data.europa.eu/euodp/it/data/dataset/sKm7xBoTFapXrD33EWRhcg
table with the situation for European countries: https://ec.europa.eu/eurostat/tgm/table.do?tab=table&plugin=1&language=en&pcode=tps00046
[28] It is worth noting, among other things, that in Lombardy 26.5% of healthcare services are managed by private individuals, with an incidence on public expenditure of only 13.5% (also demonstrating the efficiency of the private sector compared to the public sector).
[29]SWe know what the costs are, but how do we calculate the benefits for the citizen? At the aggregate level, a spannometric measure of the quality of services, which we have tried to provide here with entirely partial data, will always lend itself to endless debates. As Hayek explained: without prices there is a lack of information. It is therefore impossible to establish the value of public services, precisely because one can quantify the cost but not the quality of the service in the absence of a price system, except by trying to get a generic idea of the value of those services, using numerous proxies and with extremely in-depth analyses of infinite aspects of health care. In the text, when it says ‘today we are paying twice as much’, the calculation is trivially made in this way: health expenditure has increased by 45%, while beds have decreased by 30%. So if with 100 euros (purely illustrative figure) you bought a hospital bed for 3 days in 2002, in 2018 you needed 145 euros (+45%) to buy the same bed, but for only 2 days (minus 30%). Consequently:
before: 100€ = 3 days à 1 day = 33€
after: 145€ = 2 days à 1 day = 72.5€ (+120% approx. compared to the previous 33€, so more than double)
[30] “Council Regulation (EC) No 2166/1999 is unambiguous on the HICP’s treatment of goods and services in the health, education and social protection fields. Generally, if expenditure is incurred by a household for these products, then it should be covered in the HICP, otherwise, it is out of scope”.
Harmonised Index of Consumer Prices (HICP), Methodological Manual, November 2018 https://ec.europa.eu/eurostat/documents/3859598/9479325/KS-GQ-17-015-EN-N.pdf
[31] Public expenditure data are taken from the ISTAT data site section “Conti nazionali; Conti e aggregati economici delle pubbliche amministrazioni; Uscite annuali per sottosettore; Voci di uscita per settore (COFOG 2 e 3 cifre)
[32] https://it.wikipedia.org/wiki/LED#I_LED_bianchi_e_l’uso_nell’illuminazione I do not pass judgement on markets I do not know, but I fearfully raise the doubt that perhaps the roads today are not so much brighter than 15 years ago, at least not so much as to justify a doubling of costs.
[33] https://www.ecb.europa.eu/stats/macroeconomic_and_sectoral/hicp/html/inflation.en.html
Weight of each entry in the hicp index: https://www.ecb.europa.eu/stats/ecb_statistics/escb/html/table.en.html?id=JDF_ICP_COICOP_INW
Eurostat: https://ec.europa.eu/eurostat/web/hicp/data/database
[34] In the case of the public sector, the general appreciation of ‘services’ over money is not only due to a monetary factor. In fact, nation states continually increase costs by raising taxes or introducing disincentives and obstacles, such as bureaucratic loopholes and procedures that waste citizens’ time and money. This has been going on for a century now and completely against technological advances, as if public institutions were incapable of increasing efficiency and decreasing the burden on citizens’ pockets. From the reported data, we see that the costs of paperwork for businesses and citizens (administrative burdens in general) have increased by 22% in 5 years: an appreciation of about 4% on an annual basis. This appreciation is included in the calculation of inflation, as it is considered by statistical institutes just like any free market sector.
[35] See e.g. S. Ammous, The Bitcoin Standard, pp 153-154
[36] E.g. the Blanchard Macroeconomics. Recentemente also in the italian book of Luca Ricolfi “L’enigma della crescita”.
[37] We are talking here about private or supplementary pension systems. This does not apply to the INPS, which is a black hole that turns over contributions directly to pensioners, so it does not ‘set aside’ any money at all and is not a savings system, but a system of forced redistribution.
[38] Art. 1834 italian civil code
[39] The bank fully invests the funds we load in investment or accumulation plans (also deposit accounts), while on current accounts it only keeps a small percentage of the capital in reserve, investing the rest. A forthcoming article is entirely dedicated to the topic of fractional reserve
[40] Let’s assume that on international markets there is only Alberto the Italian, who owns 1 Italian lira, and Baldric the German, who owns 1 German mark. Alberto produces pasta and Baldric produces frankfurters. Alberto sells the pasta to Baldric in exchange for 1 mark and Baldric sells the frankfurter to Alberto in exchange for 1 lira. They both then convert their money at the money exchange: Alberto gives up the mark he just got and buys himself a lira so he can spend it more easily in Italy, and Baldric does the same by selling the lira in exchange for 1 Deutschmark. The exchange rate is 1 mark = 1 lira. Then along comes the evil Mario Draghi who prints 9 Italian lira and the lira’s supply changes to ten times that of the German mark and thus the lira depreciates (by the law of supply and demand and assuming unchanged demand). So Baldric needs only 10 cents of the mark to equalise the purchasing power that the mark previously had against the lira, and with 10 cents he buys pasta. Baldric will now be able to buy 10 pastas before Alberto can afford 1 frankfurter. If Alberto works one hour to produce one pasta, he will now have to work 10 hours to afford one frankfurter, whereas before monetary expansion he only needed one.
[41] Note that shells were not only currency in the most primitive civilisations. Until 1661, settlers in North America themselves used shells as legal tender.
[42] In 1973 in Italy the state weighed 23% of GDP, today 42%.
[43] 12% of taxpayers (i.e. those earning above 35k) pay over 53% of Italy’s total tax revenue. The 60% of taxpayers, up to 20k in earnings, pay only 13% of the revenue. 40% of taxpayers, i.e. 16 million people (or 25% of the population, 16 million out of 60) pay 87% of the revenue: https://www.albertodeluigi.com/schiavi-dello-stato-chi-paga-le-tasse-in-italia/
[44] See link in note 43
[45] They are a protected category: from 2000 to 2016 elderly employment grew by 23%, over 24 dropped by 11%. Elderly incomes increased by 84.7% in 25 years, under 35 dropped by 41%. In the 1990s the median wealth of young families was slightly higher than that of the over 65s, today the wealth of the over 65s is almost twelve times higher.
[46] If, for example, we voted on a census basis, i.e. a vote weighted according to the taxes paid (at least on issues like public spending, not criminal law), we could exercise more control over the money we individually put in. But the fact that in tax matters it is even unconstitutional to hold a referendum certifies the true reality: we are subjects, not citizens. And we have intentionally chosen to be so by mandating our constituent fathers to write the useless, redundant, harmful and even conceptually confusing text that is the Italian Constitution. After all, since the march on Rome in 1922, we have not made any cultural progress, this is glaringly obvious today especially with the coronavirus lockdown: today’s delinquents are the same as those who handed over the Jews yesterday.
[47] The tax burden has risen continuously since 1973 without interruption. The debt/GDP ratio, with the exception of a positive parenthesis between 1994 and 2007, has always risen. And we still have to pay for the disaster of the current monetary policies and coronavirus lockdowns.
[48] https://www.ecb.europa.eu/pub/economic-bulletin/articles/2018/html/ecb.ebart201806_03.en.html#toc4
[49] See link in note 48
[50] See link in note 48
[51] https://en.wikipedia.org/wiki/Reserve_currency#Global_currency_reserves
[52] as at Quarter 4 2019 $11,829bn, of which $2275bn was held in euros (19.2%) (value = 2080 euros)https://data.imf.org/?sk=E6A5F467-C14B-4AA8-9F6D-5A09EC4E62A4
[53] https://www.cia.gov/library/publications/the-world-factbook/fields/245rank.html
[54] https://en.wikipedia.org/wiki/Money_supply#Definitions_of_%22money%22